

Get Started
SpeakSport Home Dashboard: Reading Your Agent Metrics
Learn how to read your Home dashboard metrics, interpret activity trends, and use date filters to monitor your facility's AI agent performance.
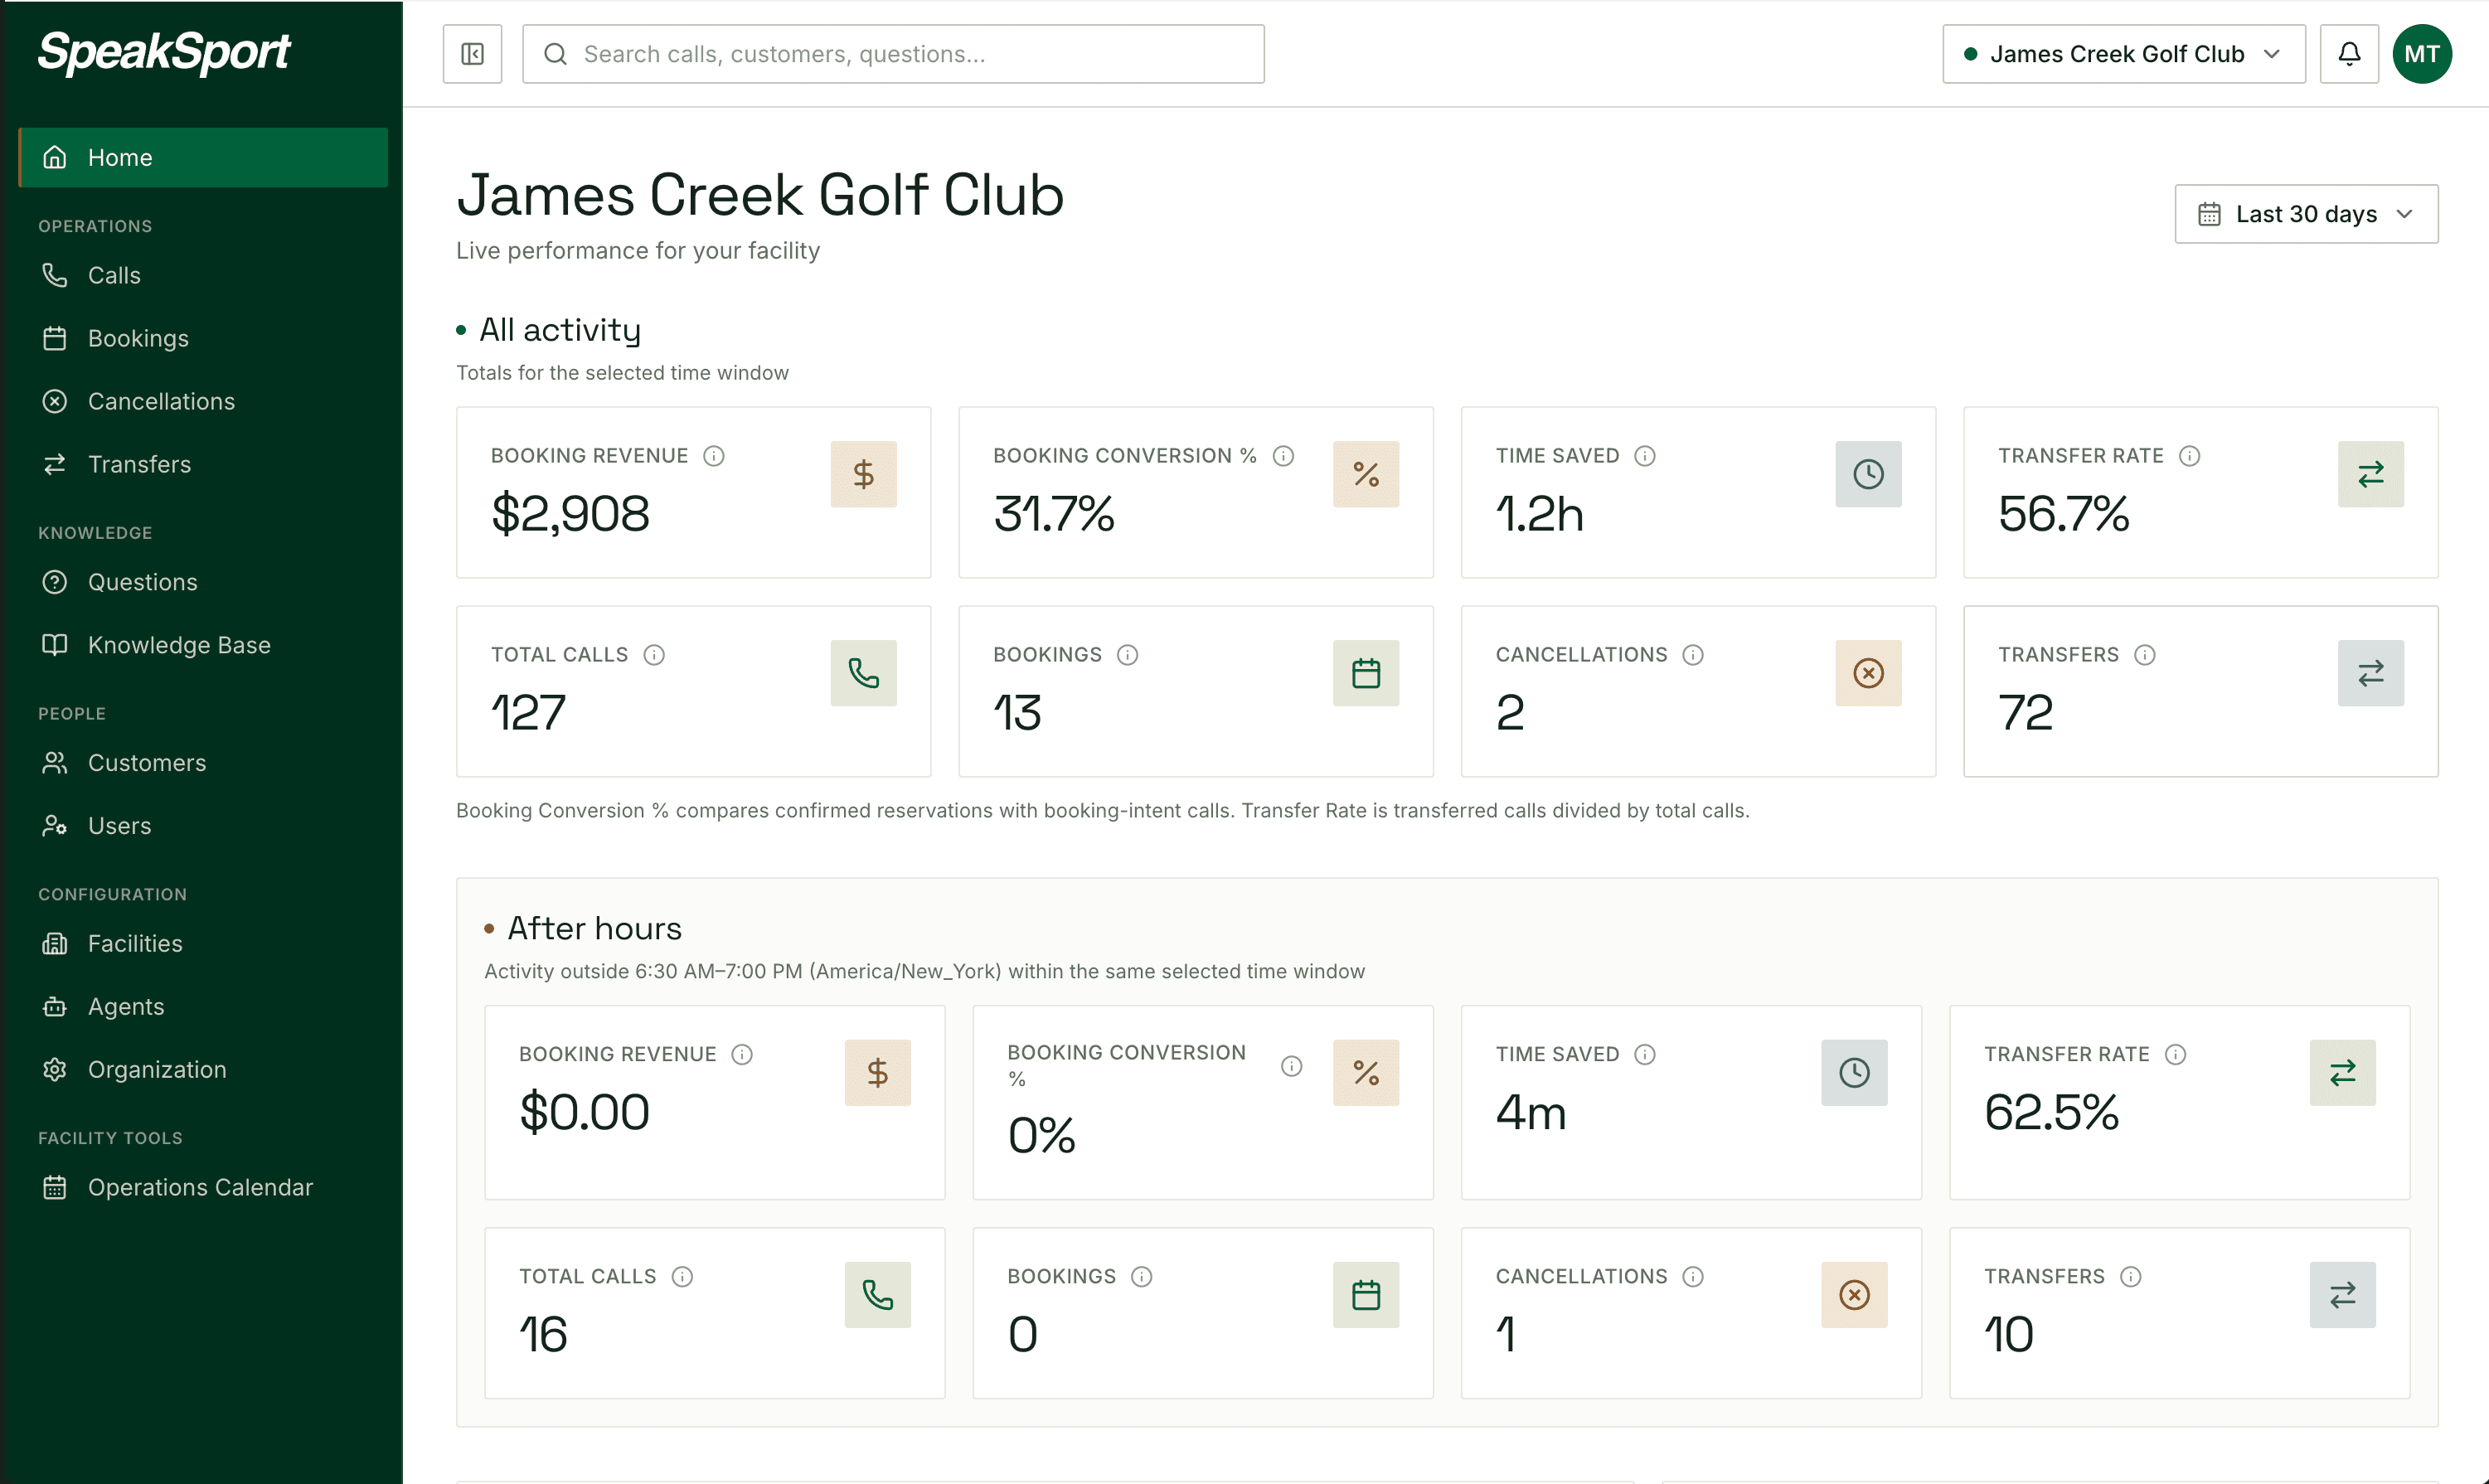
The Home dashboard gives you a real-time snapshot of how your AI voice agent is performing across your facility. From booking revenue to call transfers, every metric on this page is derived from live call data processed by SpeakSport — giving you operational visibility without needing to dig through individual call logs.
Setting Your Date Range
Use the date picker at the top of the dashboard to focus on any time window you care about.
Open the date picker
Click the date range control in the upper-right corner of the dashboard. It defaults to the last 30 days.
Choose a preset or custom range
Select a preset window — Today, Last 7 days, Last 30 days, or Last 90 days — or click any two calendar dates to define a custom start and end date.
Apply the selection
Click Apply. Every metric card, trend chart, and question cluster snapshot on the page will refresh to reflect only the activity within your chosen window.
All Activity Metrics
The All activity section shows aggregated performance data for every call your AI agent handled during the selected date range, regardless of what time those calls came in.
Revenue and time-saved figures are operational indicators only. Booking revenue reflects the value of reservations the agent facilitated, and time saved is an estimate of staff hours offset by AI handling. Neither figure is a payroll record, an accounting entry, or a guarantee of realized earnings. Always reconcile revenue against your booking system of record.
| Metric | What it measures |
|---|---|
| Booking revenue | The total dollar value of bookings confirmed through the AI agent during the period. Calculated from the rate associated with each booked slot. |
| Booking conversion | The percentage of calls where a caller expressed booking intent that ended in a confirmed reservation. Higher is better; a low rate may indicate friction in the booking flow. |
| Time saved | An estimate of total staff time offset by the AI agent, based on average handle time per call type. Use this as a directional indicator of operational efficiency, not a precise staffing metric. |
| Transfer rate | The percentage of all calls that the agent escalated to a human staff member. A rising transfer rate can signal new caller needs that the agent hasn't been trained to handle. |
| Total calls | The count of all inbound calls the AI agent answered in the selected period, including calls that were transferred, abandoned, or resolved without a booking. |
| Bookings | The number of confirmed reservations created by the agent during the period. |
| Cancellations | The number of existing reservations cancelled through the agent during the period. |
| Transfers | The raw count of calls that were handed off to a human staff member, corresponding to the transfer rate percentage above. |
After Hours Metrics
The After hours section surfaces the same eight metrics as the All activity section, but filters them to include only calls that arrived outside your facility's configured operating hours.
After-hours classification uses your facility's local timezone and the call's local start time. Calls that start within the operating hours for that date are counted as regular hours; calls outside those hours, including on closed days, are counted as after-hours activity. If you believe calls are being miscategorized, verify the timezone under Facilities → Overview → General and the applicable date range, weekly hours, and date overrides under Facilities → Availability.
After-hours metrics are especially useful for understanding the value your AI agent delivers when no staff are available. A high after-hours booking count, for example, demonstrates revenue that would otherwise have been lost to unanswered calls.
Calls and Bookings by Day
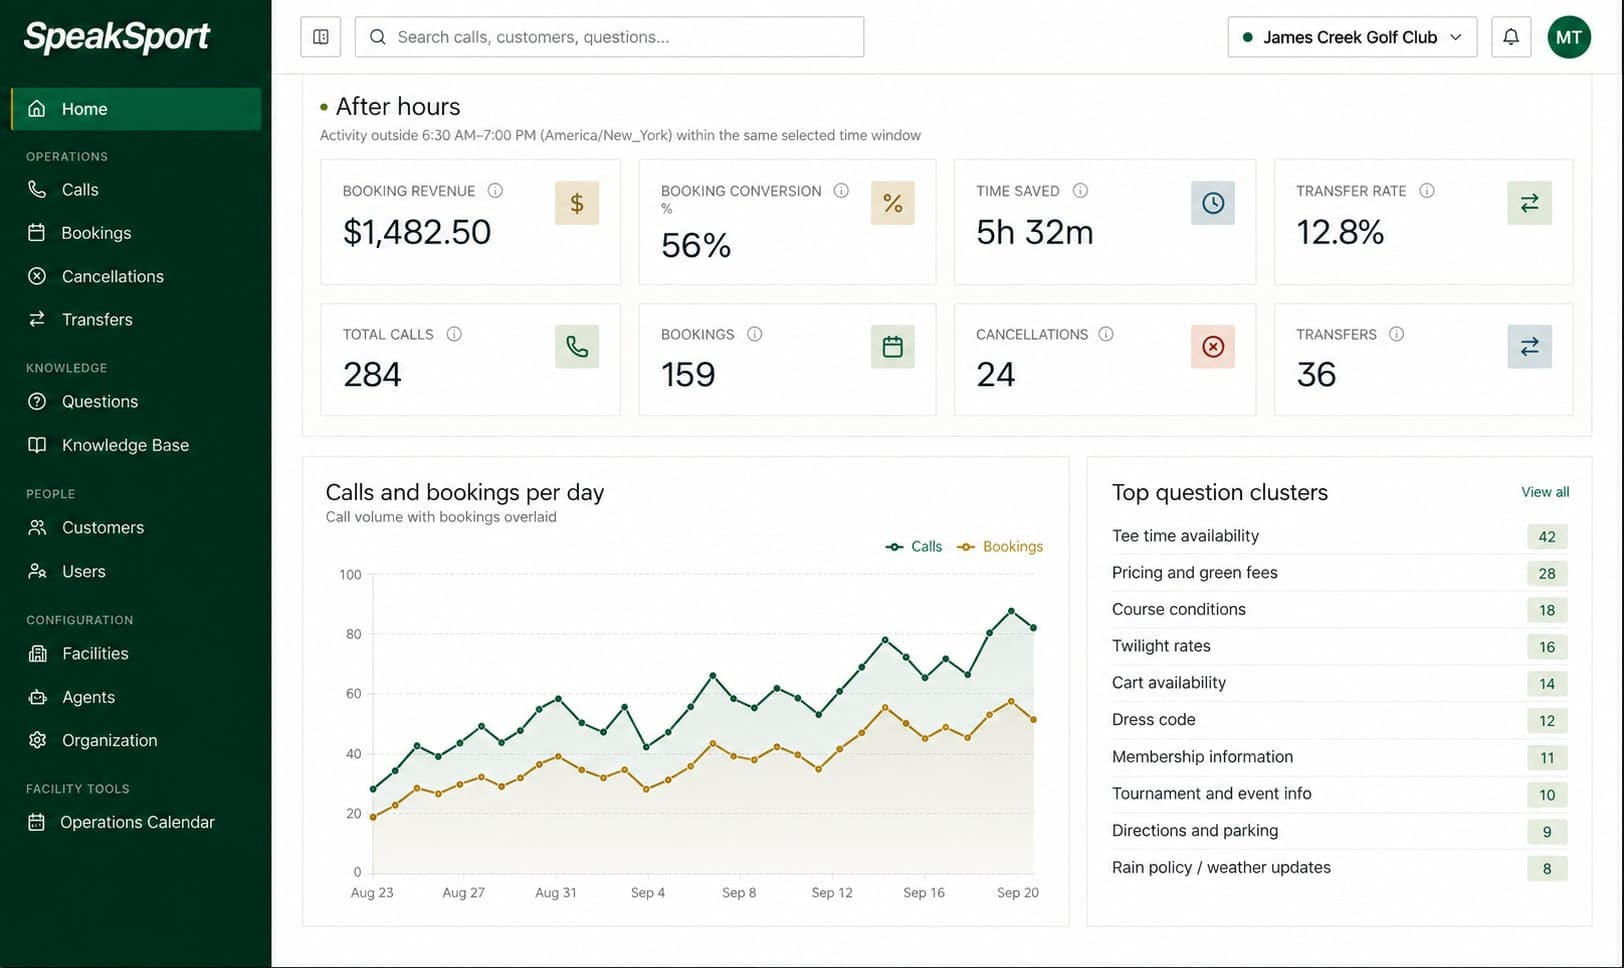
The Calls and bookings by day trend chart plots your daily call volume alongside a second activity line across the selected date range. What that second line represents depends on whether your facility has an active booking integration connected to SpeakSport:
- With an active booking integration — the second line shows confirmed Bookings: reservations that the agent successfully created in your booking system each day.
- Without a booking integration — the second line shows Booking opportunities: calls where the caller demonstrated clear booking intent (for example, asking to reserve a tee time or lesson), even though no reservation was confirmed through SpeakSport. Booking opportunities are not confirmed reservations; they indicate demand that could be captured if a booking integration were enabled.
Use this chart to spot day-of-week patterns, identify unusually quiet or busy periods, and correlate call spikes with external events like tournaments or promotions.
Top Question Clusters
The Top question clusters snapshot highlights the most common themes and topics that callers raised with your AI agent during the selected period. Clusters are automatically grouped by semantic similarity — so variations of the same question (e.g., "What are your rates?" and "How much does a round cost?") are counted together rather than split across dozens of separate entries.
This snapshot shows only a summary. To explore individual questions, review caller phrasing, or manage how the agent responds to specific topics, go to the full question clusters view.
View All Question Clusters
See every question cluster, drill into caller transcripts, and fine-tune your agent's responses.
Introduction
SpeakSport handles inbound calls for your facility — booking tee times, answering questions, and routing callers — so your staff can focus on guests.
Calls
Find and review every inbound call handled by your AI agent. Filter by date, status, direction, tags, and more, then export results as a CSV.